Perfmon is a great tool for getting lots of performance information about Microsoft products. But once you’ve got it it’s not always the easiest to work with, or present to management. As a techy you want to be able to use the data to compare systems across time, or even to cross corellate performance between seperate systems.
And management want graphs. Well, we all want graphs. For many of my large systems I now know the shape of graph that plotting CPU against time should give me, or the amount of through put per hour, and it only takes me a few seconds to spot when something isn’t right rather than poring through reams of data.
There are a number of ways of doing this, but my preferred method is to use a tool called R. R is a free programming language aimed at Statistical analysis, this means it’s pefectly suited to working with the sort of data that comes out of perfmon, and it’s power means that when you want to create baselines or compare days it’s very useful. It’s also very easy to write simple scripts in R, so all the work can be done automatically each night.
It’s also one of the tools of choice for statistical analysis in the Big Data game, so getting familiar with it is a handy CV point for SQL Server DBAs.
Setting R up is fairly straight forward, but I though I’d cover it here just so the next parts of this series follow on.
The main R application is available from the CRAN (Comprehensive R Archive Network) repository – http://cran.r-project.org/mirrors.html From there, pick a local mirror, Click the Download for Windows link, select the “base” subdirectory, and then “Download R 3.0.0 for Windows” (version is correct at time of writing 18/04/2013).
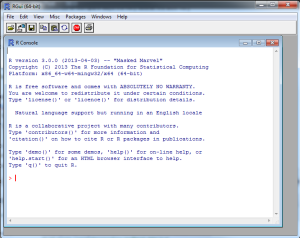
You now have an installer, double click on it and accept all the defaults. If you’re running a 64-bit OS then it will by default install both the 32-bit and 64-bit versions. You’ll now have a R folder on your Start Menu, and if you select the you’ll end up at the R console:
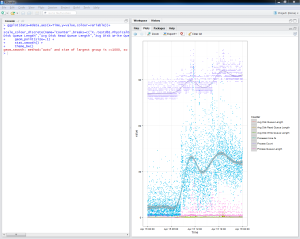
R is a command line language out of the box. You can do everything from within the console, but it’s not always the nicest place. So the next piece of software to obtain and install is RStudio, which can be downloaded from here, and installed using the defaults. This is a nicer place to work:
You should now have a working R setup. In the next part we’ll load up some perfmon data and do some work with it.


Leave a Reply