Musings of a Data professional

Stuart Moore

Tag: monitoring

Getting Perfmon Data from SQL Server into R for analysis

In the last couple of posts we’ve looked at how to migrate perfmon data from CSV files into SQL Server (
Migrating perfmon CSV files into SQL Server for analysis) and how to use R to graph Perfmon data (
Simple plot of perfmon data in R).

So, the next obvious step is to combine the two, and use R to graph Perfmon data you’ve imported into SQL Server. It turns out that R makes this pretty simple via the RODBC Package.

Assuming you’ve created a SQL Server system DSN called perfmon_odbc, then the following code snippet would plot you a lovely graph of the counters:

  • % Processor Time
  • Avg. Disk Queue Length
  • Current Connections
  • Processor Queue Length

as recorded on Server A on the 19th June 2013:

install.packages(c("ggplot2","reshape2","RODBC"))
library("ggplot2")
library("reshape2")
library("RODBC")

perfconn<-odbcConnect("perfmon_odbc")
perf<-sqlQuery(perfconn,"select distinct a.CounterDateTime, b.CounterName, a.CounterValue from CounterData a inner join CounterDetails b on a.CounterID=b.CounterID where b.MachineName='\\\\Server A' and b.CounterName in('% Processor Time','Avg. Disk Queue Length','Current Connections','Processor Queue Length') and a.CounterDateTime>'2013-06-19' and a.CounterDateTime<'2013-06-20'")

perf$CounterDateTime <- as.POSIXct(perf$CounterDateTime)
ggplot(data=perf, aes(x=CounterDateTime,y=CounterValue, colour=CounterName)) +
geom_point(size=.5) +
stat_smooth() +
ggtitle("Server A OS Metrics - 11/06/2013")
odbcCloseAll()

Note that this time we didn’t have to melt our data like we did before, as the resultset from RODBC is already in the format we need. But also spot that we’ve had to add some extra \’s to the machine name. \ is an escape character in R, so we need the extra \ to escape the escape character.

Now you’ve all the flexibility of creating the dataset via T-SQL. This means you can start doing things like comparing 2 Servers across the same time period:

install.packages(c("ggplot2","reshape2","RODBC"))
library("ggplot2")
library("reshape2")
library("RODBC")

perfconn<-odbcConnect("perfmon_odbc")
perf<-sqlQuery(perfconn,"select distinct a.CounterDateTime, b.MachineName+' '+b.CounterName as 'CounterName', a.CounterValue from CounterData a inner join CounterDetails b on a.CounterID=b.CounterID where b.MachineName in('\\\\Server A', '\\\\Server B') and b.CounterName in('% Processor Time','Avg. Disk Queue Length','Current Connections','Processor Queue Length') and a.CounterDateTime>'2013-06-19' and a.CounterDateTime<'2013-06-20'")

perf$CounterDateTime <- as.POSIXct(perf$CounterDateTime)
ggplot(data=perf, aes(x=CounterDateTime,y=CounterValue, colour=CounterName)) +
stat_smooth() +
ggtitle("Server A &amp; B OS Metrics - 11/06/2013")
odbcCloseAll()

Note that in this SQL query we’ve specified 2 machine names, and then to make sure that R can distinguish between the counters we’ve appended the Machine Name to the Counter Name in the column list. I’ve also taken out the geom_point(size=.5) line, as with the number of counters now being plotted having the data points make the curves hard to see and compare.

You can extend this to pull the counters for a Server from 2 different days. This makes it easy to check if the spike is a normal daily occurence, or really is the source of your current issues:

install.packages(c("ggplot2","reshape2","RODBC"))
library("ggplot2")
library("reshape2")
library("RODBC")

perfconn<-odbcConnect("perfmon_odbc")
perf<-sqlQuery(perfconn,"select distinct a.CounterDateTime, 'Day 1 -'+b.CounterName as 'CounterName', a.CounterValue from CounterData a inner join CounterDetails b on a.CounterID=b.CounterID where b.MachineName='\\\\Server A' and b.CounterName in('% Processor Time','Avg. Disk Queue Length','Current Connections','Processor Queue Length') and a.CounterDateTime>'2013-06-19' and a.CounterDateTime<'2013-06-20' union select distinct a.CounterDateTime, 'Day 2 -'+b.CounterName, a.CounterValue from CounterData a inner join CounterDetails b on a.CounterID=b.CounterID where b.MachineName='\\\\Server A' and b.CounterName in('% Processor Time','Avg. Disk Queue Length','Current Connections','Processor Queue Length') and a.CounterDateTime>'2013-06-12' and a.CounterDateTime<'2013-06-13'")

perf$CounterDateTime <- as.POSIXct(paste("1900-01-01", substr(perf$CounterDateTime,12,28)))
ggplot(data=perf, aes(x=CounterDateTime,y=CounterValue, colour=CounterName)) +
stat_smooth() +
ggtitle("Server A Metrics - 13/06/2013 and 19/06/2013")
odbcCloseAll()

In this case we union the 2 results sets, and rename the counters to make sure R can identify which set are which date. We also set the date component on the time stamps to be the same day (I use 01/01/1900 as it’s nice and obvious when looking at a chart later to see that it’s been reset), this is to make sure R plots the time values against each other correctly.

Using R to average perfmon statistics and plot them

In the last post (Simple plot of perfmon data in R) I covered how to do a simple plot of perfmon counters against time. This post will cover a couple of slightly more advanced ways of plotting the data.

First up is if you want to average your data to take out some of the high points. This could be useful if you’re sampling at 15 second intervals with perfmon but don’t need that level of detail.

The initial setup and load of data is the same as before (if you need the demo csv, you can download it here):

install.packages(c("ggplot2","reshape2"))
library("ggplot2")
library("reshape2")

data <-read.table("C:\\R-perfmon\\R-perfmon.csv",sep=",",header=TRUE)
cname<-c("Time","Avg Disk Queue Length","Avg Disk Read Queue Length","Avg Disk Write Queue Length","Total Processor Time%","System Processes","System Process Queue Length")
colnames(data)<-cname
data$Time<-as.POSIXct(data$Time, format='%m/%d/%Y %H:%M:%S')

avgdata<-aggregate(data,list(segment=cut(data$Time,"15 min")),mean)

avgdata$segment<-as.POSIXct(avgdata$Time, format='%Y-%m-%d %H:%M:%S')
avgdata$Time<-NULL
mavgdata<-melt(avgdata,id.vars="segment")

ggplot(data=mavgdata,aes(x=segment,y=value,colour=variable))+
+ geom_point(size=.2) +
+ stat_smooth() +
+ theme_bw()

The first 8 lines of R code should look familiar as they’re the same used last time to load the Permon data and rename the columns. Once that’s done, then we:

10: Create a new dataframe from our base data using the aggregate function. We tell it to work on the data dataframe, and that we want to segment it by 15 minute intervals, and we want the mean average across that 15 minute section
11: We drop the Time column from our new dataframe, as it’s no longer of any us to us
12: Convert the segment column to a datetime format (note that we use a different format string here to previous calls, this is due to the way that aggregate writes the segment values.
13: We melt the dataframe to make plotting easier.

And then we use the same plotting options as we did before, which gives us:

R plot of perfmon data at 15 minute average

If you compare it to this chart we plotted before with all the data points, you can see that it is much cleaner, but we’ve lost some information as it’s averaged out some of the peaks and troughs throughout the day:

Perfmon data plotted on graph using R

But we can quickly try another sized segment to help out. In this case we can just run:

minavgdata<-aggregate(data,list(segment=cut(data$Time,"15 min")),mean)
minavgdata$Time<-NULL
minavgdata$segment<-as.POSIXct(minavgdata$Time, format='%Y-%m-%d %H:%M:%S')
mminavgdata<-melt(minavgdata,id.vars="segment")

ggplot(data=mminavgdata,aes(x=segment,y=value,colour=variable))+
+ geom_point(size=.2) +
+ stat_smooth() +
+ theme_bw()

Which provides us with a clearer plot that our original, but keeps much more of the information than the 15 minute average:

R plot of perfmon data at 1 minute average

Migrating perfmon CSV files into SQL Server for analysis

Up to a certain size and for quick sampling using perfmon data in a CSV file makes life easy. Easily pulled into Excel, dumped into a pivot table and then analysed and distributed.

But once they get up to a decent size, or you’re working with multiple files or you want to correlate multiple logs from different servers, then it makes sense to migrate them into SQL Server. Windows comes with a handy utility to do this, relog, which can be used to convert perfmon output to other formats. Including SQL Server.

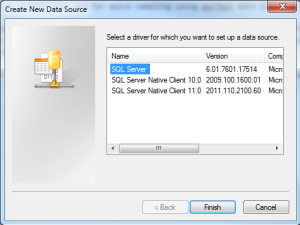
First off you’ll need to set up an ODBC DSN on the machine you’re running the import from. Nothing strange here, but you need to make sure you use the standard SQL Server driver.

Make sure you use the standard SQL Driver when setting up an ODBC connection for relog to load perflog data into SQL Server

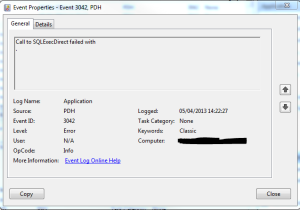
If you use the SQL Server Native Client you’re liable to run into this uninformative error:

0.00%Error: A SQL failure occurred. Check the application event log for any errors.

and this also unhelpful 3402 error in the Application Event log:

The informative 3402 message relog returns if you're using the wrong ODBC driver

Once you’ve got that setup it’s just the syntax of the relog command to get through. The documentation says you need to use:

-o { output file | DSN!counter_log }

What it doesn’t say is that counter_log is the name of the database you want to record the data into. So assuming you want to migrate your CSV file, c:\perfmon\log.csv, into the database perfmon_data using the DSN perfmon_obdbc, you’d want to use:

relog "c:\perfmon\log.csv" -f SQL -o SQL:perfmon_odbc!perfmon_data

Running that you should get a nice whirling % count as your records are loaded up to SQL Server.

Powered by WordPress & Theme by Anders Norén